When working in the Azure portal finding task information when performing tasks against an object that is related to an object can be tough. Before I dive into the how, let me demystify what I’m talking about a little more, as that first statement is a little vague. In the case of my example I want to see the status of building an Azure Internal Load Balancer which I was deleting using the Azure portal.
There is no section within the Azure portal that you can use to see Internal Load Balancers directly. You can only see them from within the Virtual Machine. But if you are deleting them from the portal then you might not be able to see the Internal Load Balancer anymore.
So to see what’s happening to need to know where to find this related information in the Azure Portal.
The trick to doing this is looking at the events which were done on the resource group within the Azure Portal. Now the nice thing about these events is that it doesn’t matter if the events are triggered through the Azure Portal or Azure Powershell.
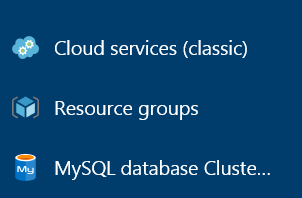
To get to these events, you can either click on Resource Groups from the main Azure panel (you may need to click browse if it isn’t shown as one of your favorites) like you see below.
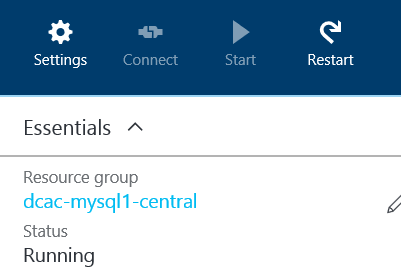
Or you can go through another object within the Resource Group such as a Virtual Machine. Personally I usually end up clicking through from a VM, because I’m usually working on a load balancer which is done from the settings of the VM, so I already have that panel up. You’ll find the Resource Group at the top of the main panel of the VMs just under the settings button as shown below.
Either way you get there, you’ll end up on the properties of the Resource Group. With that panel open, scroll down on the panel and you should see a monitoring tile that looks something like this.
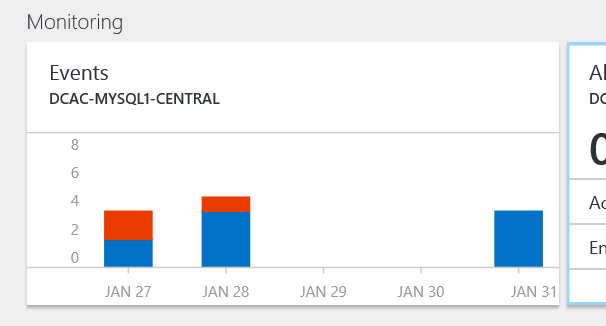
While that is a very pretty little tile it doesn’t give a whole lot of details. But you can click on the tile and get a lot more useful information. When you click on the tile the new blade that opens shows the same basic graph, but bigger. If you scroll down in that blade you’ll see details about those events as shown below.
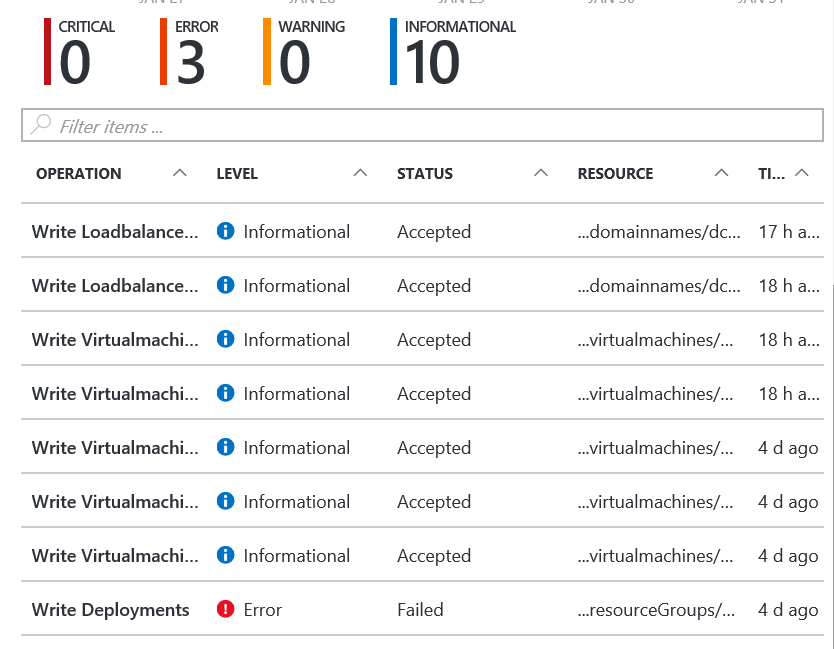
If you click on the text in the Operation column, another blade will open which gives you the details of that operation.
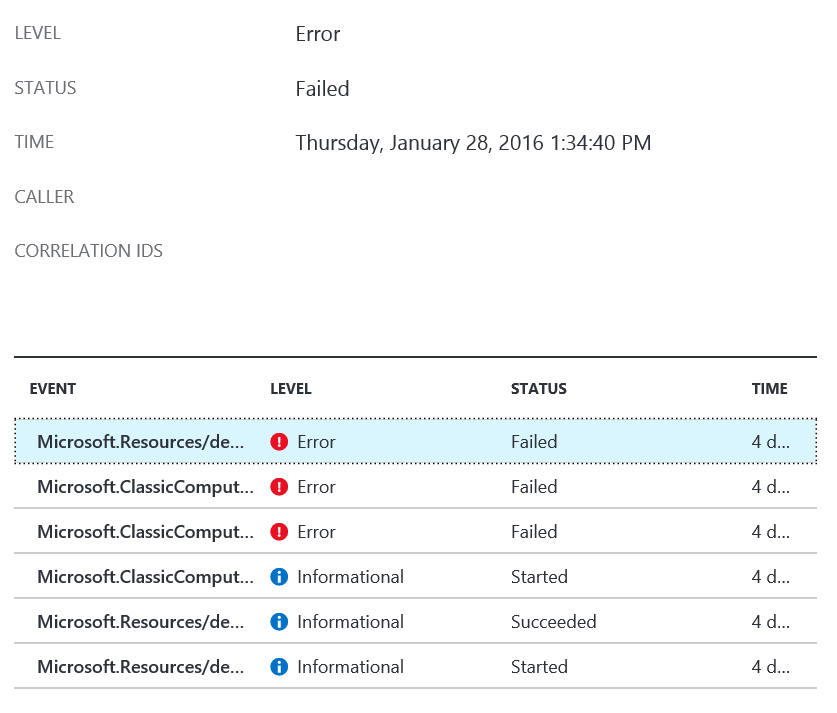
In the details blade you’ll see all the various steps which were required for this operation to happen. If we click on one of those details, yet another blade opens. If we scroll to the bottom of that blade we’ll see some useful text which looks mostly like English.
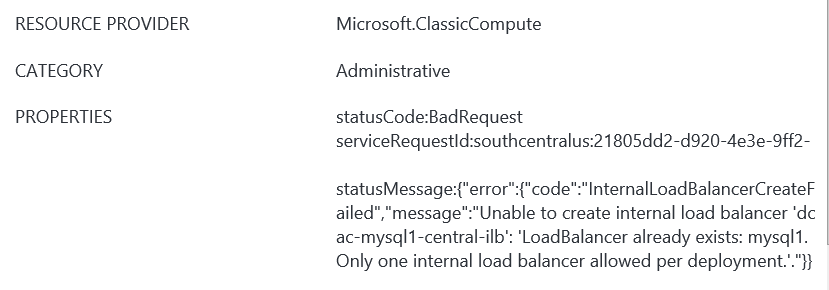
Now in my case it’s a pretty easy to read error message. The Internal Load Balancer couldn’t be created because one already existed in the resource group, and you can only have one ILB per resource group. Sometimes the error text isn’t displayed at all, or it isn’t the most clear information in the world. It all depends on what you are trying to do and why it failed.
If you have commands which you run in PowerShell that throw a generic error message, you’ll probably get more details from in here that you were able to get in PowerShell as it depends where in the Azure stack the error occurred and if that component was configured to bubble the actual error message up or just log it and throw a generic error message to the calling application, your PowerShell window in this case.
In any case, this should help you find the information that you are looking for in Azure when things don’t quite go according to plan.
Denny
The post Viewing task status for related objects in the Azure Portal appeared first on SQL Server with Mr. Denny.