A couple of weeks ago DCAC moved our website from being hosted in a single data center to being a globally distributed web application with multiple 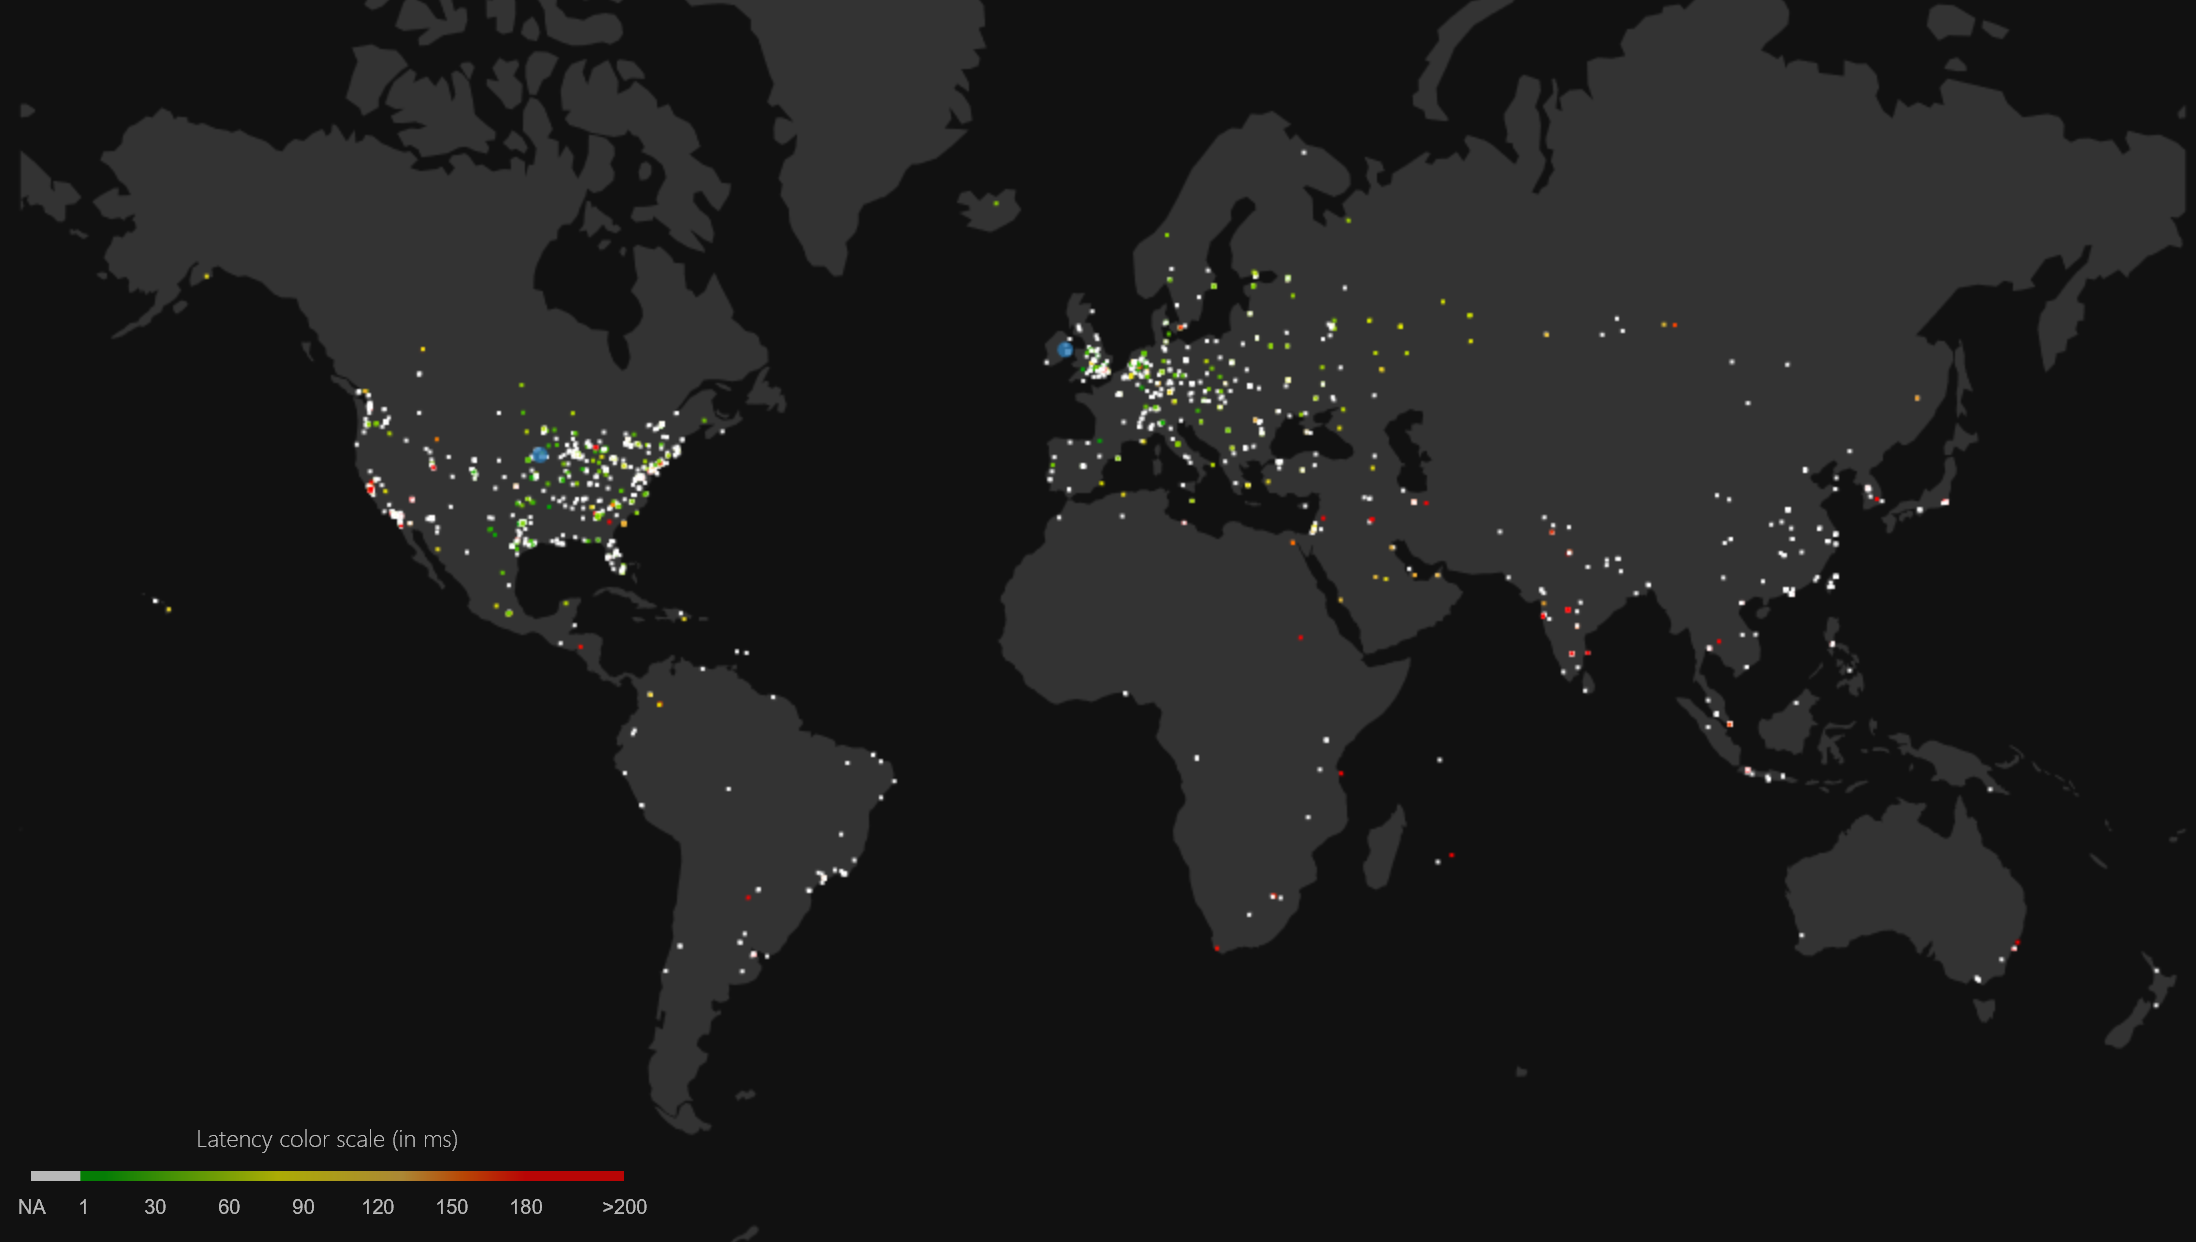 Azure WebApps with one hosted in the US and one in Europe. As part of having traffic manager configured and enabled for our site, we get some free reporting on performance of our webapp that’s included as part of the package. As you can see from our performance chart which we can see on the left, we can see where in the world our readers are coming from, and depending on if the system is able to capture it or not, we can see the performance that those users are getting (all the colors in the chart).
For some users, we aren’t able to get back performance data, and those users are shown in White. The users who are shown in a color (blue/green is good, red is bad) the system was able to get performance data for.
There is a little change which helps gather real-time measurements of data. Within the settings for Traffic Manager, there’s a setting for “Real Time 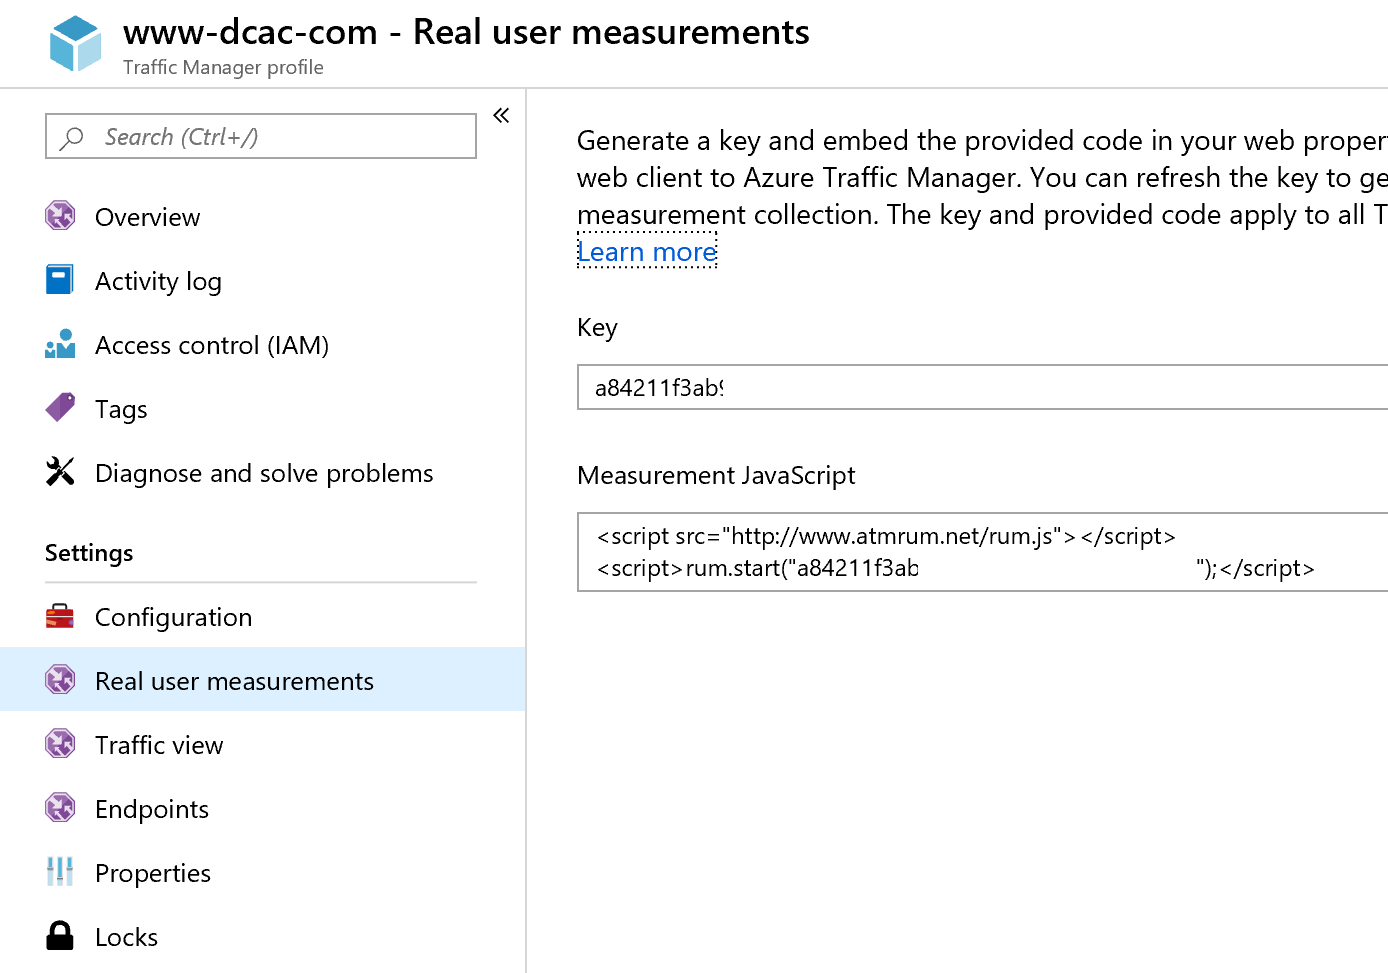 measurements” which gives you a little bit of javascript to include in your website (I’ve removed our key from the picture). You’ll want this javascript on every page that you have on your website. If you’re using WordPress like we are, we were able to have this on every page by putting it in the default footer that’s part of our theme. The code that’s in the Measurement JavaScript box in the Azure portal, I copies and put in our Theme’s footer between the <?php wp_footer(); ?> and the </body></html>. This put the code at the very bottom of the page, so even if there’s a delay in loading it, it won’t affect our website performance.
By using this basic reporting, we can see some pretty valuable information.
- We can see where our website viewers are coming from
- We can see what the performance for our viewers are
By showing us where in the world the folks reading our website, our coming from this gives us more insight into what kinds of things we should continue to write about. It also gives us insight into where we might need to deploy additional WebApps for better performance so that users in those areas get better performance.
By showing us the performance that users are getting around the world, we can see roughly what kind of performance improvement that users will see if we deploy another copy of our website to their region. As we can see from the graph users from India, South East Asia, Australia, and Africa are getting 200ms or higher performance levels from browsing our website. Based on this it might make sense to deploy another copy of the website into Singapore (which would improve performance in South East Asia, India, and Australia) and another copy of our website to the South African data center to improve performance for users in Africa.
Creating additional WebApps in these regions isn’t a give-in. 200ms isn’t a guarantee that there’s a problem. In our case we can talk to people in those various regions of the world and have them browse to the website and see if there’s a problem with viewing the website or not. In this case, the data that’s available from Azure is just a piece of the puzzle to see if there is a performance problem or not. This is because only the information that’s available for the portal isn’t everything.
Denny
The post Free Performance Metrics from Traffic Manager appeared first on SQL Server with Mr. Denny.