In my opinion, SQL Server 2019 is one of the greatest releases of the product that Microsoft has ever produced. The amount of improvements across the platform really allows data professionals to have better and faster queries while simultaneously minimizing effort. One of the many things that it fixes is the ability to get an actual plan without having to re-run the query.
Currently, if you are not on SQL Server 2019 and wanted to see an execution plan, you would attempt to dive into the execution plan cache to retrieve an estimated plan. Keep in mind that this just an estimated plan and the actual plan, while the shape should be the same, will have runtime metrics. These Actual runtime metrics could be, different than what is shown in the estimated plan, so it is important to get the actual whenever possible.
With the introduction of lightweight statistics, SQL Server can retain the metrics of the actual execution plan if enabled. Note that this could introduce a slight increase in overhead, however, I haven’t yet seen it be determinantal. These metrics are vastly important when performing query tuning.
Metrics:
- Actual number of rows per operator
- Total CPU time
- Total execution time
- Actual maximum degree of parallelism
- Memory granted and subsequently used
Two new items are also introduced for this particular feature, one being a new database scoped configuration, LAST_QUERY_PLAN_STATS, and the other a new dynamic management function, sys.dm_exec_query_plan_stats.
Let us look at both.
LAST_QUERY_PLAN_STATS
Introduced in SQL Server 2016, database scoped configurations allow you to have more granular control of how the database is going to behave. LAST_QUERY_PLAN_STATS can either be set globally with trace flag 2451 or on each individual database. It does require compatibility level of 150 so you must be on SQL Server 2019 to take advantage of this new ability. You can enable this database scoped configuration with this command.
ALTER DATABASE SCOPED CONFIGURATION SET LAST_QUERY_PLAN_STATS = ON
Like with anything else, there is a minor overhead with enabling this. SQL Server does have to work just a tad bit harder to capture and store the runtime metrics for the plans. This overhead should be minimal but as always, proper testing should be completed against your given workloads.
SYS.DM_EXEC_QUERY_PLAN_STATS
Along with the new database scoped configuration comes a new dynamic management function, or DMF. This DMF requires the plan_handle, which is obtains by cross applying it with one of the other dmvs, such as:
- dm_exec_cached_plans
- dm_exec_query_stats
- dm_exec_requests
- dm_exec_procedure_stats
- dm_exec_trigger_stats
Here is an example query:
SELECT * FROM SYS.DM_EXEC_CACHED_PLANS CP
CROSS APPLY SYS.DM_EXEC_QUERY_PLAN_STATS(CP.PLAN_HANDLE)  PS
WHERE PS.DBID = 10
Let’s take a look at this feature in action.
Finding the Last Known Actual Plan
Using WideWorldImporters, let’s first ensure that the database is at compatibility level of 150 and the new database scoped configuration is also enabled.

We can see that it is now at the correct compatibility level and the database scoped configuration is also been enabled. Now we can run a query and go find the actual plan utilizing the new DMF.
I am going to do a simple join between the Sales.Orders and Sales.OrderLines tables. After the results are returned, I’ll interrogate the new DMF using sys.dm_exec_cached_plans as a way to get the plan handle
select * from sales.orders o
       inner join sales.OrderLines ol on o.OrderID=ol.OrderID;
select size_in_bytes,cacheobjtype,objtype,plan_handle,ps.dbid, ps.query_plan
from sys.dm_exec_cached_plans cp
       cross apply sys.dm_exec_query_plan_stats(cp.plan_handle) ps
where ps.dbid = 10
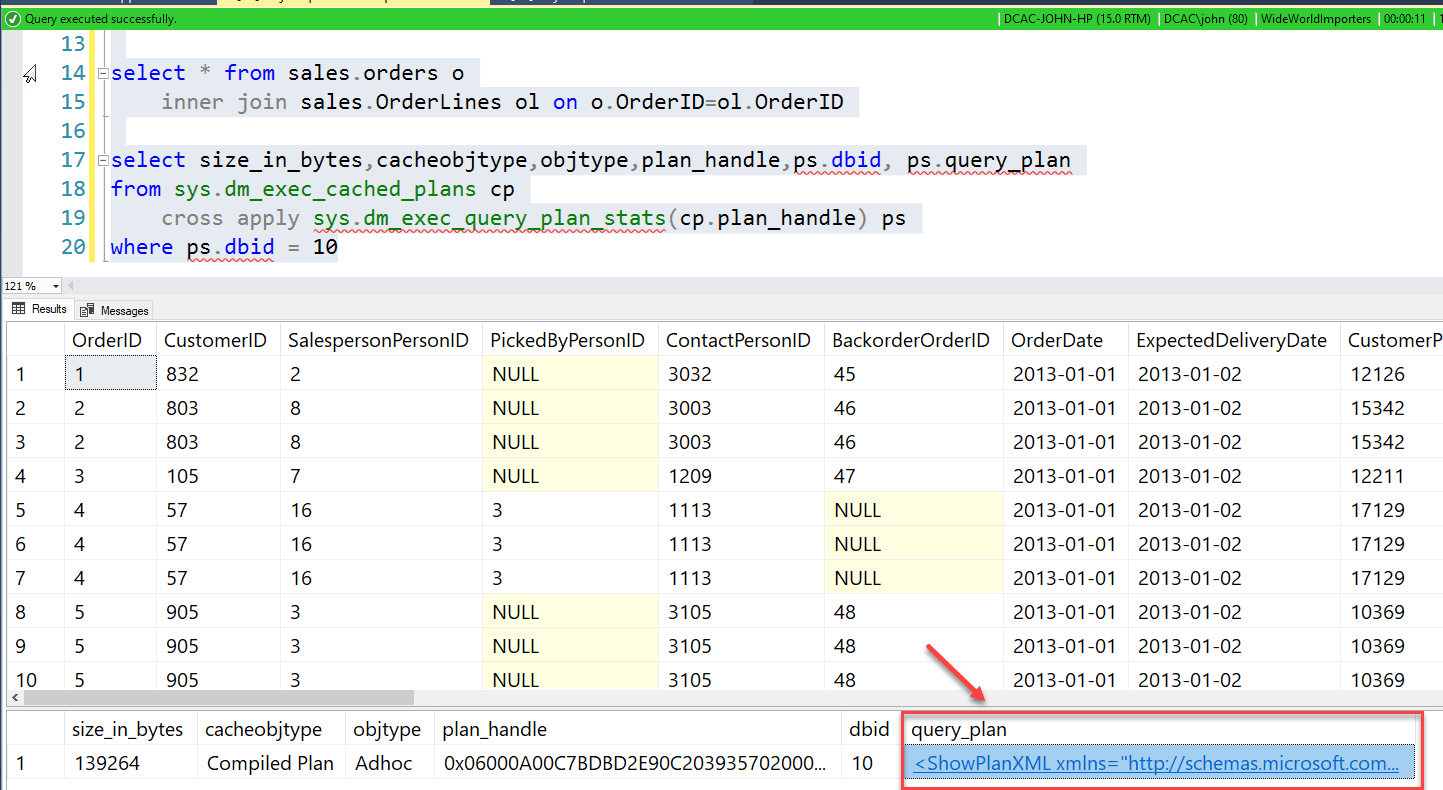
The resulting query_plan column is being derived from the new DMF. If you click on the hyperlink in SQL Server Management Studio, it will open the query plan. Once opened, hit F4 or right click to show the properties of the plan and select the Clustered Index Scan of the Sales.OrderLines table.

You can now see the actual runtime statistics that SQL Server captured when the query was executed.
Summary
As I mentioned at the beginning of this post, SQL Server 2019 is one of the best releases of the product that Microsoft has ever accomplished. Features such as lightweight query profiling and LAST_QUERY_PLAN_STATS just continue to make the data professionals life that much easier.
Have you migrated to SQL Server 2019 yet? Are you using this feature? If you are, drop me a note! I’d love to hear about your experience with it!
© 2020, John Morehouse. All rights reserved.