Index seeks are good, right? Normally they are, unless the index that you are seeking against isn’t the correct index. If we look at Figure 1 everything in this plan looks good, right?
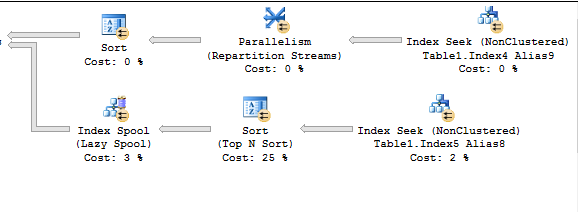
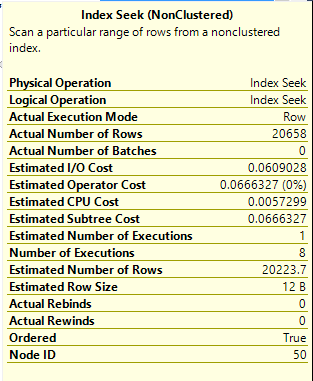
The cost of the index seek against Table1.Index4 is 0%, the IO cost is very low as is the CPU cost. So where’s the problem? The prblem is that the index seek is being executed over 20k times. We can see this by looking at the tool text information about the specific operator which we can see in Figure 2.
Because of this the other operators are executed ones for each row which is returned, causing each of them to then be executed 20k times once for each row from the parent side of the join. We can see this a little better if we look at the exeuction plan in SQL Sentry Plan Explorer which we can see in Figure 3.
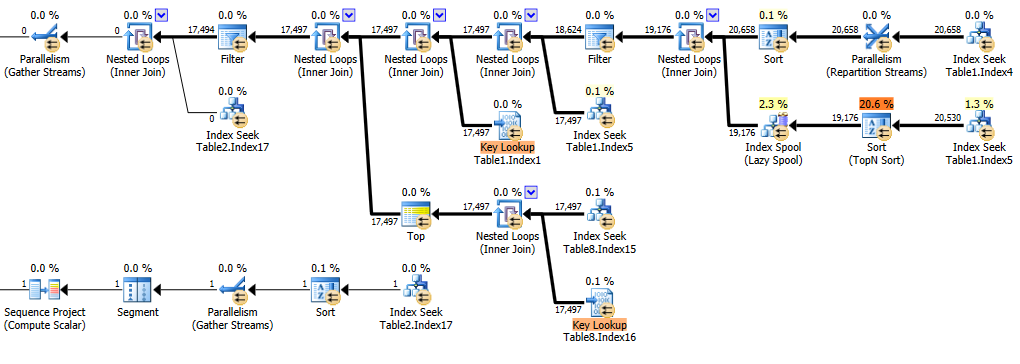
Counting the operators and the number of executions we can estimate the amount of IO that this query is going to generate when the query is run. Just looking at the operators on the right hand side of the plan, and ignoring everything else we can see ~320k seeks and/or lookups. If we assume that each seek and/or lookup requires 3 IOPs that’s about ~960k IOPs. That’s about 7.3GB just for this portion of the plan. That doesn’t include work tables, spills, etc.
This specific query is executed thousands of times per hour for 8-10 hours per day. Assuming that it’s just 1000 executions per hour for 8 hours a day, that’s ~570TB of logical IO per day, for one query.
I don’t care how many CPUs the system has, or how fast the RAM is on the server, that’s going to cause some massive delays when running the query. In this perticular case this query is run every time a user clicks a button within the application. This button click would take 6-8 seconds to complete.
So how do we fix this problem. We need to look at the query that is using this plan. We see that the index which is being used is filtering based on a status column, which means that there are 20k rows which have the status set to active. When we add an index on the table, which matches the other predicates of the query (the where clause). When we did this to this specific system, the first index seek which was executed dropped from ~20k rows being returned to 5. The number of executions for the other operators also dropped to a small number (we also fixed the indexes so that they would address the key lookup problems). When all was said and done we reduced the when to running in just a few milliseconds and we went from almost 1M IOPs to several hundred IOPs.
Because of all the extra logical IO that the SQL Server was doing for these queries the CPU was running quite high as well. There were 24 vCPUs allocated to the Virtual Machine, which were running about 45% CPU workload. After adding in the indexes for this query, the CPU workload dropped to an average of 4% workload with spikes to 7%. A massive improvement.
It just goes to show, that just because your query is seeking on your indexes that doesn’t mean that you are done tuning your query.
Denny
One Response
Please can you explain which line on the Tool Tip is saying that the number of executions is 20k? I see Number of Executions = 8. I think I am not understanding something