People have done creative things with SVG measures in Power BI, ranging from KPI cards to infographics to fun games.
For my latest Workout Wednesday challenge, I used SVG measures to make holiday cards that open on a specified date.

When you click on one of the holiday cards, it navigates to a specified url. This was made possible by using the HTML Content custom visual.
The navigation to the URL is achieved by modifying the SVG code to include an href attribute. Depending on the placement of the href attribute, you can make one part of the SVG image or the entire image navigate to a URL when clicked.
Step by Step
To make a clickable SVG image for Power BI, there are 7 steps:
- Open the url in a text editor or html editor
- Replace all double quotes with single quotes
- Add href attribute around the content you want to be clickable
- Create a measure in Power BI and paste the contents of the SVG
- Add the HTML Content visual to a report page
- Populate the values of the visual with the measure
- In the format pane for the visual, set Allow Opening URLS to On.
For example, I have an SVG of a coffee cup.

If I open it in Notepad++ (you can also use Visual Studio code or another editor), it looks like this.

Because we are putting the contents in a DAX measure, we need to replace the double quotes with single quotes.

Then I add the href attribute. I want my entire image to navigate to my website (DataSavvy.me) when it is clicked. So I add <a href='https://datasavvy.me'> just after the opening <svg> tag, and I add a closing </a> at the end. Remember that the URL should be surrounded by single quotes rather than double quotes.

Then I create a measure called SVG. I enter double quotes, paste the content from Notepad++, and add closing quotes as the end. Because I’m using the HTML content visual, I don’t have to add "data:image/svg+xml;utf8," at the beginning of my measure as I would if I were using this in a table visual.
Now I add the HTML Content visual and put my SVG measure in the Values field well.
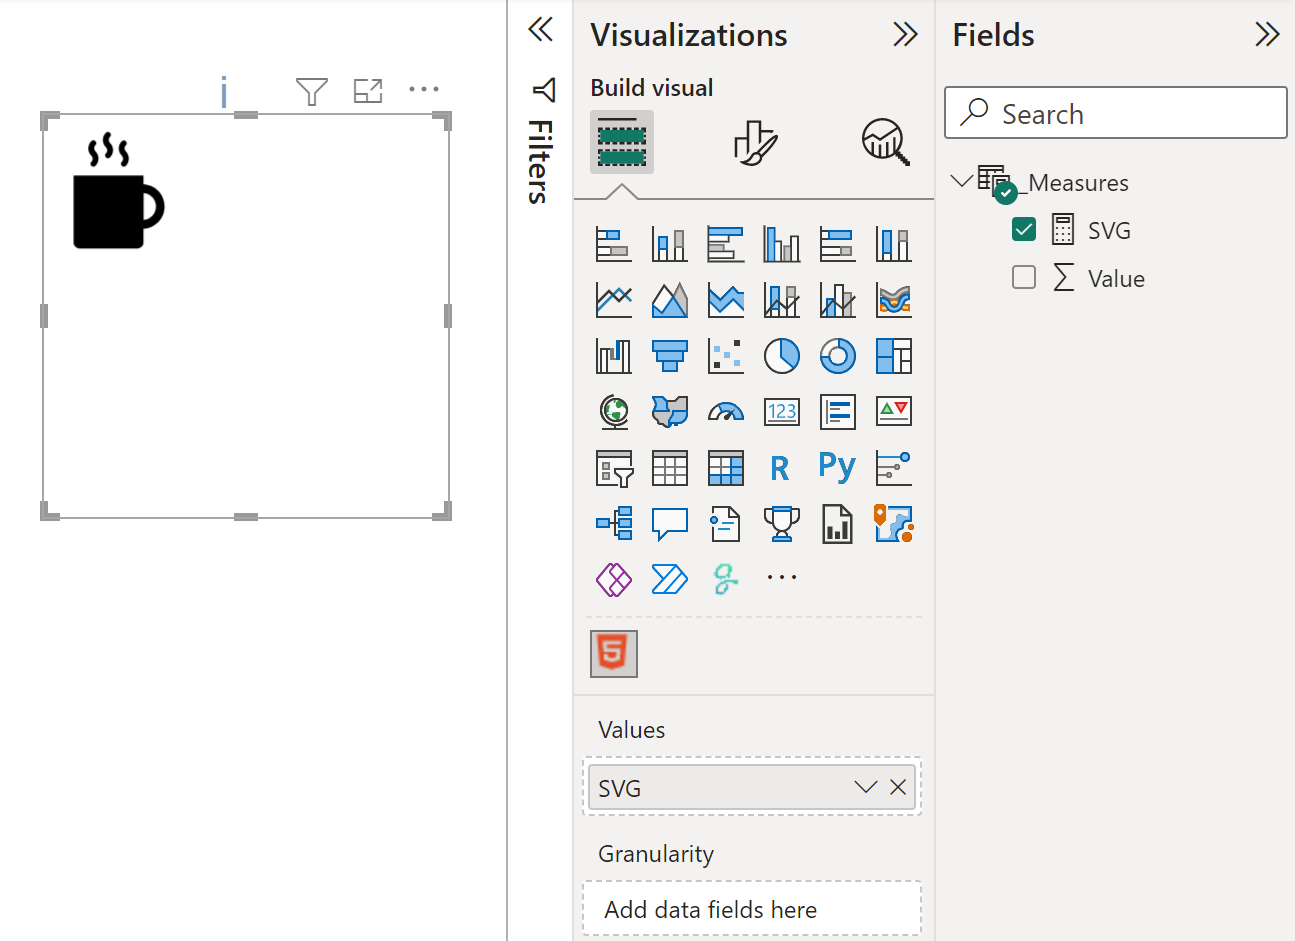
With the visual selected, I go to the formatting pane, expand the Content Formatting section, and turn Allow Opening URLs to On.

When I hover over the image, the cursor changes, indicating the image is clickable.

When I click the image, I get a prompt to allow navigation to the url I put in the SVG.

New possibilities unlocked
While static clickable SVGs are pretty cool, the potential is really in the fact that we can dynamically populate the SVG based upon data in our dataset. You can change the entire image or an attribute of the image (color, size, URL, etc.) based upon a slicer selection.
Now that you can make dynamic clickable images in Power BI, how do you plan to use them?