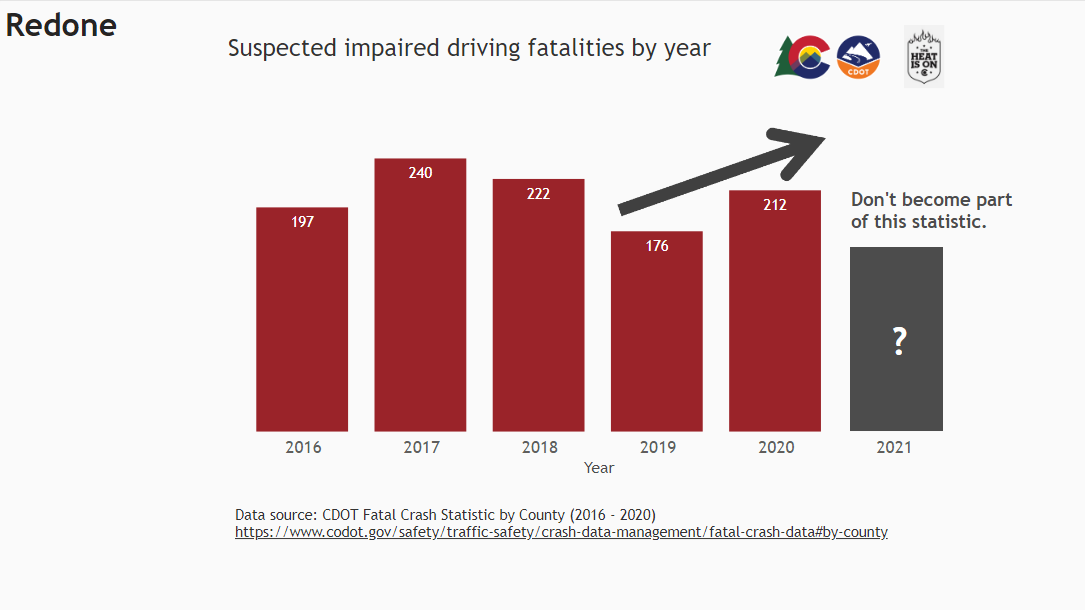
As I was browsing Twitter today, I noticed a tweet from the Colorado Department of Transportation about their anti-DUI campaign. Shown below, it contains a bar chart that appears to have been presented in PowerPoint.
#CDOT #News: CDOT, @CSP_News, and other local law enforcement agencies are coming together for a late summer DUI campaign from Aug. 18 to Sept. 6. Impaired drivers will be removed from the roads ahead of and during Labor Day weekend.
— Colorado Department of Transportation (CDOT) (@ColoradoDOT) August 17, 2021https://t.co/v8bcHluIHH#KnowBeforeYouGo pic.twitter.com/Y1eK4rXlMT
There are some easy opportunities to improve the readability of this chart, so I thought I would use it as an example of how small improvements can have a big impact on a fairly simple chart. I recreated the chart (as best I could) in Power BI and then made two revised versions.


Especially when making data visualizations for the general public —and especially when you want to get people’s engagement on social media— you need to reduce perceived cognitive load. Otherwise, people won’t even bother to read your chart. If your chart feels too busy or too complicated, many people in your intended audience will feel it is not worth the effort to even try to read it and will move on down their Twitter feed to the next Anakin and Padme meme.
Watch the video below for all of the details.