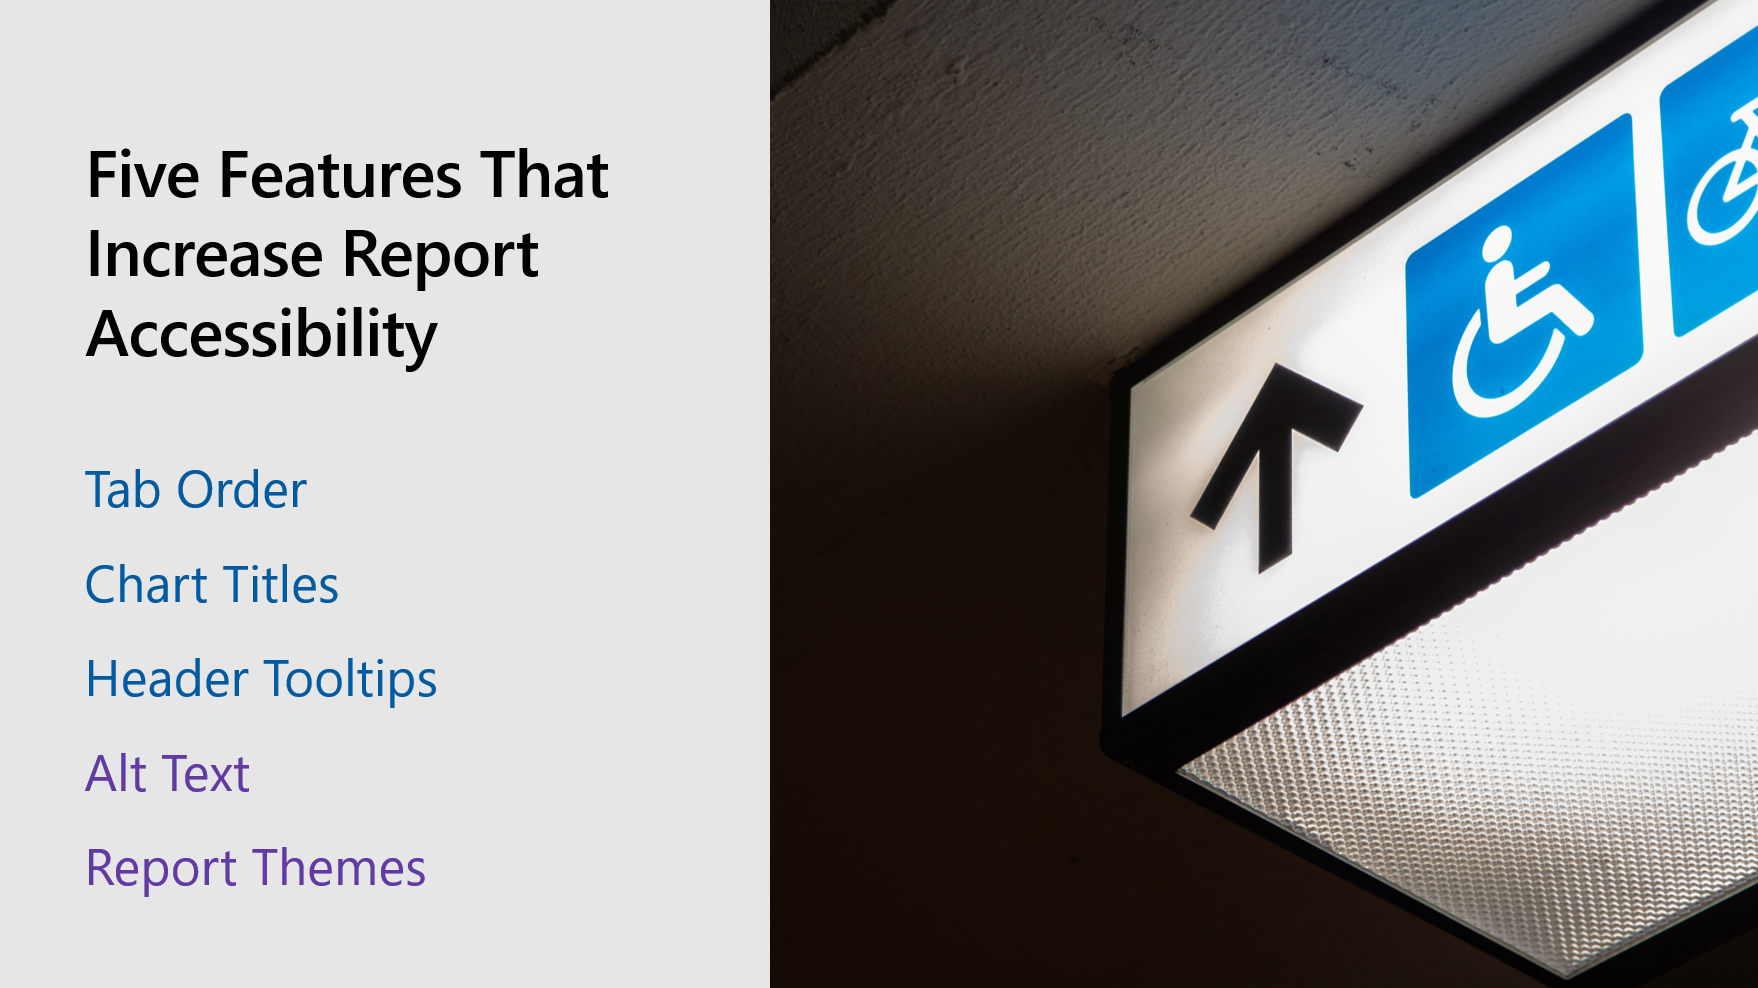
I had the privilege of working with Tessa Hurr (PM on the Power BI team) on a presentation for the 2020 Microsoft Business Applications Summit (MBAS) about five features in Power BI that increase report accessibility. This 23-minute presentation is almost entirely demos, and only a few slides. While we talk about some features such as alt text and tab order that are primarily used for accessibility purposes, we also talk about how chart titles, header tooltips, and report themes can be used to make your report more accessible.

The conference was entirely online this year, and you can catch the sessions on demand now. I hope you’ll take some time to watch my session as well as the other great content that came from the conference. You can watch my session on the MBAS website.
