Recently a client asked me to put the memory usage for their Virtual Machines on an Azure Dashboard. Sadly this metric isn’t available in the normal Azure Dashboard selection. The available metrics are related to CPU, Network, and Disk (IO) but not the memory of the virtual machine.
To pull up the memory data I had to work through a couple of easy steps. The first step was to feed data to Azure Log Analytics. After that a quick KQL query would pull the most recent memory counter data. The needed KQL query is pretty straight forward.
Perf
| where ObjectName == "Memory" and
(   CounterName == "% Committed Bytes In Use"
)
|  summarize avg(CounterValue) by bin(TimeGenerated, 15min), Computer, _ResourceId
| render timechart
If you want to filter this down to a set of specific machines that can be done by adding in a little bit to the where clause of the KQL script to match the computer name. In the example KQL code below we are looking for all the machines with “Web” in the machine name. This is done by adding ‘and Computer contains “Web”‘ into the where clause of the script.
Perf
| where ObjectName == "Memory" and Computer contains "Web" and
( CounterName == "% Committed Bytes In Use"
)
| summarize avg(CounterValue) by bin(TimeGenerated, 15min), Computer, _ResourceId
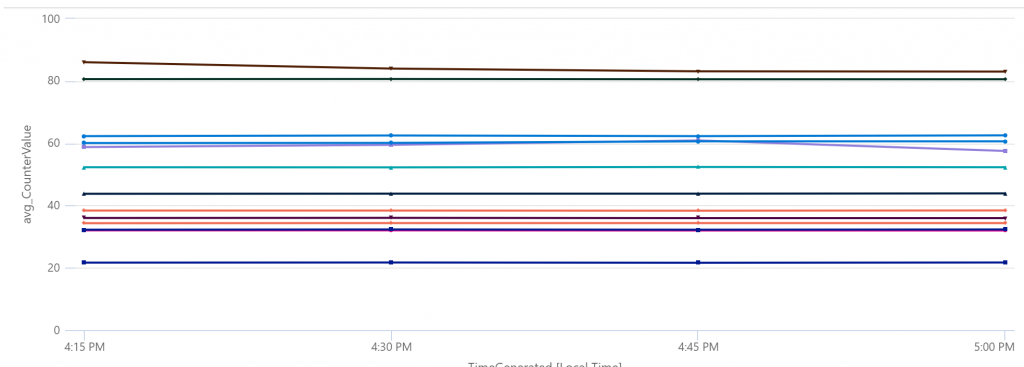
| render timechartWhen the first sample query is run it’ll produce a graph similar to the one shown below. Each line is a separate Azure Virtual Machine (the machine names aren’t being shown for obvious reasons). Several different chart options are available from Log Analytics, but personally, I prefer a line chart for this (Meagan may disagree with me here, and she’s probably correct but I’m stubborn).
Once the script is created push the Pin to dashboard button and the graph (and the script which creates it) will be pushed to the dashboard which you select.
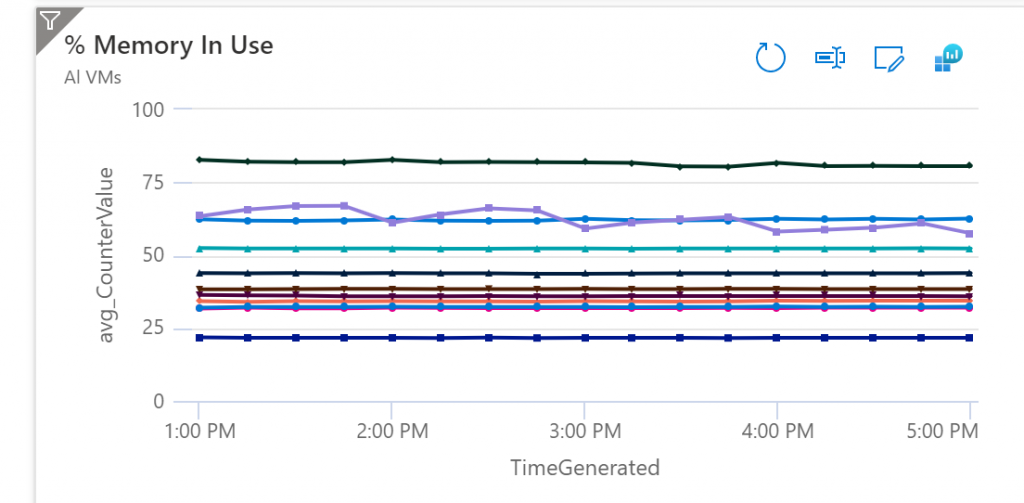
Once the script is pushed to a dashboard the graph can be seen much like the one below. You can edit the properties and make the title and subtitle a little more useful. By default, the values will be pretty useless but you can make them meaningful.
Once that’s done you have the memory counters for the selected virtual machines on an Azure Dashboard.
Denny